I. Financial Pressure
Like any institution, a law school's economic viability depends on revenues being sufficient to cover costs/expenditures. Although some law schools have significant endowments that provide some operating revenue, most do not. Virtually all law schools depend heavily on tuition, with many schools deriving substantially all revenue from tuition. This was not a problem when demand for legal education allowed schools to steadily raise tuition revenue.
First-year (1L) enrollment gradually increased from the early 1970s to its peak in 2010. Total enrollments set all-time records in 2008, 2009, and 2010, fueling already-ballooning budgets. In 2011, however, 1L enrollment began to fall dramatically. By 2014 1L enrollment had fallen a total of 28%. Transparency, attention to high costs, and an uninspired job market erased decades of 1L enrollment gains. Today, law schools face the fifth year of enrollment crunch.
Declining enrollment may provide advantages for prospective law students. Fewer applicants mean it is easier to get into a more prestigious school. With law schools competing to attract qualified applicants, strong students have more generous scholarship offers. At graduation, lower enrollment means fewer graduates to compete with for entry-level jobs. For law schools, however, drastically lower enrollment spells financial trouble when they cannot quickly shed costs or raise revenue, whether through tuition increases, fundraising, borrowing, or non-JD program revenue. The following table shows the cumulative impact of smaller enrollment (per class) on tuition revenue using the average tuition paid per student ("net tuition") for public, private, and for-profit schools.
| Type | Avg. 1L Decline | Net Tuition | Cumulative Revenue Loss |
|---|---|---|---|
| Public | -46 Students | $17.4k | -$2.4 million |
| Private | -81 Students | $32k | -$7.8 million |
| For Profit | -133 Students | $32k | -$12.9 million |
What revenue loss means for a school depends on a host of factors, including relative budget size and other revenue streams. On average, 69% of revenue at law schools comes from tuition. [ABA Task Force on Financing Legal Education ("ABA TF Report"), pg 22] A striking 25% of law schools receive at least 88% of revenue from tuition. The Task Force found that the schools with the most in common with our "serious risk" schools were the most tuition dependent, with 95% of revenue coming from tuition. Based on data from the Department of Education, the six for-profit law schools receive between 77% and 88% of revenue from federal student loans, a subcategory of tuition revenue because some students pay cash for at least some of the tuition bill.
Many healthy businesses have diversified revenue streams so that a loss of 28% of a customer base would not necessarily devastate their entire business. By and large law schools derive the lion’s share of revenue from JD tuition. A decline of 28% in enrolled students — their paying customers — likely translates into a loss of 28% of total revenue or more because many schools have been forced to significantly discount tuition to keep their enrollments from dropping even further. And at the schools that lose many students to transfers, the financial pressure is even more pertinent. Faced with such a precipitous decline in revenue, many law schools have made the ethically questionable choice to dramatically lower admissions standards.
II. Choices: Enroll At-Risk Students to Forestall Financial Pressure
Traditional indicators point to falling standards
There is more to the story than falling enrollment. From the most prestigious law schools to the least heralded, law school is easier to get into than ever before. The LSAT scores and GPAs of recent incoming classes have moved progressively lower. Part of the problem is that students with the highest LSAT scores are disproportionately choosing not to attend law school, but the main driver of lower entrance credentials is financial pressure.
When assessing LSAT and GPA scores for an entering class, the ABA requires schools to publish data on the interquartile range (25th and 75th percentile) and median (50th percentile) for each credential. Throughout the analysis section we refer to the 25th percentile LSAT score as LSAT-25. We use a similar convention for all LSAT and GPA quartile marks, e.g. GPA-75. Modern LSAT scores range from 120 to 180, with scores falling on a classic bell curve. When discussing LSAT performance, we use the score (120-180) and the percentile score (i.e. the score's place on the bell curve) because it provides more precision for comparisons.
Overall, schools have done a better job maintaining their LSAT-75 than the LSAT-50 or LSAT-25 when comparing 2010 LSATs to 2014 LSATs.
| LSAT-25 | LSAT-50 | LSAT-75 | |
|---|---|---|---|
| Score | 155.2 151.9 | 158.1 155.4 | 160.5 158.2 |
| Percentile Change | -11.6 | -9 | -6.9 |
So what?
On average, the bottom is falling out, but many individual schools now confront a much bleaker situation than average. This is not necessarily a problem, even if it makes for great copy for journalists. The LSAT provides a flawed window into an individual's ability to help future clients. Indeed, one study on effective lawyering found that high LSAT scores negatively correlate with several competencies that form the basis for effective lawyering. Worrying about the across-the-board drop in LSAT scores for new law students requires something more compelling than schadenfreude.
That connection is clear but not as straightforward as declaring that lower LSAT scores mean law schools fail students, the profession, and/or society. Even critics of the LSAT acknowledge that effective lawyering requires a law license, which requires passing the bar exam. According to the Law School Admissions Council's (LSAC) National Longitudinal Bar Passage Study, the LSAT is the best predictor before law school as to whether a student will pass or fail the bar exam. If a school admits students who face a high risk of failing the bar, we must ask whether the school is exploiting those students and whether other parties are complicit.
...
Using data from all jurisdictions combined, the logistic regression analyses showed that both adjusted LGPA and LSAT score were statistically significant factors in explaining bar examination outcomes.Failing to earn a license does not eliminate all of the value law schools provide, but that failure significantly decreases the value of a law degree for a typical graduate. Fewer students would undertake three years of law school and significant debt without the prospect of practicing law.
Reasonable people have long debated the effectiveness of the bar exam in screening those who are competent to practice law. As long as the bar exam guards entrance to the legal profession, however, law schools must consider an applicant's likely chances of success on the bar; they should also be accountable for the bar passage rate of their graduates. With the LSAT currently serving as the best pre-law school predictor of bar passage, LSAT scores of students are central to law school accountability.
The ABA accreditation standards reinforce the notion that law schools must be held accountable for graduate bar exam outcomes. The standards also reinforce the relevance of LSAT scores in examining whether law schools make responsible enrollment choices. The standards extend latitude to law schools for making admissions decisions. However, the standards do explicitly entitle the ABA to monitor back-end outcomes and front-end enrollment choices in determining whether law schools adequately serve the public and treat students fairly.
(b) A law school shall not admit an applicant who does not appear capable of satisfactorily completing its program of legal education and being admitted to the bar.
Interpretation 501-1
Among the factors to consider in assessing compliance with this Standard are the academic and admission test credentials of the law school's entering students, the academic attrition rate of the law school's students, the bar passage rate of its graduates, and the effectiveness of the law school's academic support program.
While a person's potential as a lawyer cannot be accurately measured by the LSAT, and a better tool for evaluating this potential is a desirable goal, we face an immediate problem of preventing the exploitation of prospective and continuing law students. We must all work on adjusting the entrance path to law school and the profession in a way that selects and nurtures the best lawyers. But at the same time, we must protect today's students and the profession's reputation. We cannot allow an increasing number of law students to enroll in a quest that is unlikely to succeed when the stakes are so high. Declining LSAT scores of admitted students is the first indicator of a potential bar passage disaster that won't be evident for three years to the students who are affected, and four years to the ABA. We cannot be afraid to use the best tool we have.
Despite rhetoric about providing opportunities to underserved groups and choosing to admit students based on what they believe it takes to be an effective lawyer, we must not be fooled into believing that the schools taking unjust risks by admitting students with poor entrance credentials are doing so for the public good. Schools today are admitting students who would not have gained admission to any law school five years ago. These students have not suddenly become more capable of passing the bar exam.
Instead, only one factor seems to account for these admissions: tuition money. Reluctant to close, lay off large numbers of employees, take significant salary cuts, or, at some for-profit schools, yield lower profits, many marginal schools have taken to enrolling large numbers of students who are unlikely to pass the bar exam. This is unacceptable in a profession that values ethical behavior.
Ascertaining risk
The LSAT is the best tool we currently have for predicting a law school applicant's likelihood of passing the bar exam. Years of historical data show a strong correlation between LSAT scores and the risk of bar failure. Sound public policy will hold law schools accountable for taking too large of a risk in violation of accreditation, professional, and moral standards.
| Risk Band | LSAT | |
|---|---|---|
| Score | Percentile | |
| Minimal Risk | 156-180 | ≥ 67.4 |
| Low Risk | 153-155 | 55.6 - 63.9 |
| Modest Risk | 150-152 | 44.3 - 52.5 |
| High Risk | 147-149 | 33 - 40.3 |
| Very High Risk | 145-146 | 26.1 - 29.5 |
| Extreme Risk | 120-144 | ≤ 22.9 |
The table to the left reflects an analytical framework for assessing the risk of bar failure for six bands of LSAT scores. The framework was developed by David Frakt, a former law professor and advocate of legal education reform. He developed the framework while working on bar success for students at Western State College of Law. The framework was also informed by his experience on the faculty at Barry University School of Law, and draws on the research of others, including Gary S. Rosin at South Texas College of Law, and statistics published by the National Conference of Bar Examiners (NCBE).
The framework represents only a starting point for assessing the risk of bar failure. A student with a low LSAT score but very high undergraduate GPA, for example, has less risk of failing the bar than a student with the same LSAT score and a very low UGPA. Some law schools have also been more successful than others in helping students with low LSAT scores succeed on the bar exam. Where the student takes the bar exam matters as well.
On average, however, students with LSAT test scores in each band are more likely to experience academic attrition and/or bar exam failure than students in the next higher band. If a school dips into lower LSAT bands to fill its class, the risk of bar failure at that school increases. This framework, therefore, offers a useful tool for analyzing which schools are enrolling a significant number of students who face genuine risk of not finishing school or passing the bar. Importantly, this framework shows when relative change in incoming student credentials matters.
Although risk specifically refers to a student's chances of success based on LSAT score, in general we refer to schools by risk profile. If a school is high risk, then at least 25% of the school's incoming class or more faces high risk of not completing school and of failing the bar. "Serious risk" schools have risk profiles in the high, very high, or extreme risk categories. Students with an LSAT in these categories are "at risk."
Differences by state
Although ABA accreditation allows graduates from ABA-approved law schools to take the bar exam in any state, exam difficulty differs across the states due to test composition and scoring procedures. You can view bar exam "cut scores" here, which provides a good proxy for bar exam difficulty.
An at-risk student who takes an "easy" bar exam has a better chance of passing the bar than one who takes the exam in a more demanding state. Conversely, even lower risk students may face a significant chance of failing the California bar, which is consistently rated as one of the hardest in the nation. Since many schools feed a regional market, the same trends affect schools.
Overall, however, the framework identifies schools that are admitting a significant number of students who suffer a high risk of failing the bar. It also demonstrates the growing risk levels at many schools. We applied the framework to interquartile range and median LSAT scores at 197 ABA-approved law schools. (Excluded schools here.)
Risk profiles and 2013 bar performance
The graduates who took the July 2013 bar exam were a talented group. Nationally, their mean score on the Multistate Bar Exam (MBE) was the fourth highest recorded since 1980. That success was predictable based on their entering qualifications in 2010. Based on LSAT-25, 87 law schools admitted classes with minimal risk of bar failure; 39 welcomed classes with low risk; and 41 accepted classes with modest risk. Together these schools averaged an 85% first-time bar passage rate in 2013, the year that 2010 1Ls took the bar. All but seven enjoyed first-time rates above 75%. The exceptions clustered in states with particularly difficult bar exams.
Thirty other schools, however, admitted classes in 2010 that included a significant percentage of students at high risk of failing the bar exam. Eight schools admitted classes with an LSAT-25 in the very high or extreme risk band. All of those schools reported a first-time bar passage rate below 75% in 2013. The rate at one school was just 46.6%. At the 22 schools with an LSAT-25 in the high risk band, bar passage also lagged. Ten of those schools registered a first-time rate below 75%. Most of the others were in states with the easiest bar exams.
Although the 2013 bar results demonstrate the overall relationship between LSAT risk bands and bar passage, they also show the influence of other factors. Three schools reported a 2013 bar passage rate over 85%, despite a 2010 LSAT-25 qualifying as high risk. Two of those schools are located in states with the easiest bar exams, South Dakota and Alabama. The third school failed over 5% of its entering class and had a low risk LSAT-50 and minimal risk LSAT-75. Overall admissions and academic policies can improve a school's pass rate.
Risk profiles correlate strongly with bar success at an anonymous school
| Bar Exam Results, Anonymous School | ||
| Risk Profile | Pass Rate | |
| First-Time | Eventual | |
| Minimal | 88% | 96% |
| Low | 63% | 75% |
| Modest | 50% | 68% |
| High | 23% | 58% |
| Very High | 19% | 38% |
| Extreme | 16% | 36% |
One law school senior administrator provided LST access to its bar exam results by LSAT score and law school GPA over the past seven years under the condition that LST does not disclose any information that will identify the school. The sample is the entire population. As with LSAC's study, law school GPA predicts bar performance slightly better than the LSAT, but LSAT scores were still a significant predictor of bar success. In particular, the school found that bar exam performance quickly deteriorated for graduates who entered law school with an LSAT score less than 150. This was true for both first-time and eventual passage rates.
One important caveat: this anonymous school is located in a state with a difficult bar exam. For this reason and others, the pass rates reported by this school would not apply to all schools or applicants taking all bar exams. The strong correlations at this school, however, illustrate why LSAT risk profiles matter when predicting bar performance for a group of students.
Risk profiles correlate strongly with bar success at the University of Denver Sturm College of Law
| Bar Exam Results, Denver | |
| Risk Profile | First-Time Pass Rate |
| Minimal | 89% |
| Low | 84% |
| Modest | 71% |
| High | 57% |
| Very High | 39% |
| Extreme | 27% |
The University of Denver provided LST access to its first-time test-taker bar exam results by LSAT score and undergraduate GPA over the past 14 years. The sample is the entire population. As with LSAC's study, LSAT scores are a significant predictor of bar success. The school found that bar exam performance quickly deteriorated for graduates who entered law school with an LSAT score less than 150.
About 10 years ago, the school went through a bar passage crisis. DU's first-time pass rate in Colorado was 57% in February 2005, 18% below the state average. In 2008, the school made a series of data-driven bar passage initiatives to raise its first-time bar passage rates to nearly 90%.
Between 2007 and 2008, DU cut class size by over 20%, despite a modest increase in enrollment at all ABA-approved law schools. DU made the choice to decrease enrollment and focus its admissions policy on bar failure risk based on the data the school shared with LST. The school also changed its grading policies and tailored a curriculum for selected students. As DU's dean Martin Katz put it, "This type of data-driven policy works." He added that DU is "committed to avoiding the trap of admitting students who can help pay the bills, but who have too low a chance of passing the bar."
One important caveat: this school is in Colorado, where the bar exam is above-average difficulty. For this reason and others, the pass rates reported by DU would not apply to all schools or applicants taking all bar exams. The strong correlations, however, illustrate why LSAT risk profiles matter when predicting bar performance for a group of students.
Risk profiles are consistent with the LSAC National Longitudinal Bar Passage Study
In 1998, LSAC released a study of bar examination performance (initially discussed in Section I). The study, which drew data from almost all ABA-accredited law schools, found a significant correlation between LSAT scores and bar passage. Although this study dates from 1991, the findings are not stale. The LSAT is equated over time to ensure that scores remain comparable; this makes the LSAC study informative today. Translating the old scoring scale (10-48) to the new scale (120-180) is the main challenge. Fortunately, Professor Robert Anderson provided LST the percentile scores for the old scoring scale, allowing us to map the two scoring systems on to each other.
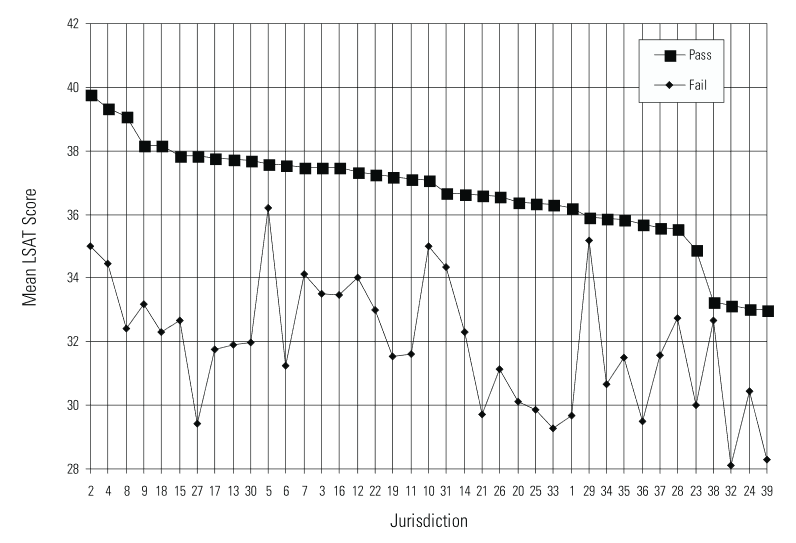
The chart to the right from the LSAC study shows the relationship between mean LSAT and first-time bar outcomes for the students examined in the LSAC study. For the successful test-takers, the mean LSAT ranged from 33 to 40, which translates to 152 to 161 on the current scale. For unsuccessful test-takers, the mean LSAT ranged from 28 to 36 (146 to 157 on the current scale). Although mean scores varied by state, depending on the difficulty of that state’s exam, the relationship between LSAT and bar passage held steady across all jurisdictions.
For the LSAC group as a whole, the mean LSAT for successful test-takers was 36.8 (157 on the current scale). Though the mean LSAT for unsuccessful test-takers was not reported, we estimate it at 31.8 (about 150 on the current scale). The LSAC study supports the line we draw above, classifying students who score less than 150 as at high, very high, or extreme risk of bar failure.
According to Table 12 of the LSAC study, the eventual bar pass rate for students with an LSAT above 36.8 (157 today) was 98.1%. Those scoring lower had an eventual pass rate of 90.9%. LSAC, however, did not separate the latter group by score band, so it is impossible to know eventual pass rates for students in the weakest bands. Other evidence cited by LSAC suggests that performance declined within each band. Students scoring less than 32 on the LSAT (150 today), therefore, would not have enjoyed a 90.9% eventual bar passage rate.
Although the LSAC study demonstrates the relationship between LSAT scores and bar passage, it most likely overstates the likelihood of bar passage at each score level. The author of that study noted that the subject class, which entered law school in 1991, had one of the highest LSAT profiles ever recorded. The average LSAT-50 (computed using a weighted average of the six school clusters) was 38 (80th percentile), equivalent to a 160 (80.4 percentile). The average LSAT-50 was 158.1 in 2010 and 155.4 in 2014. At least a dozen states, meanwhile, have raised the passing score on the bar exam since the early 1990s. Today's examinees are likely to fare worse than those in the early 1990s. How much worse is a question we can answer in three years.
Many law schools take concerning risks
Entering Students, 25th Percentile LSAT
| 2010 | |||||||||
| 2011 | |||||||||
| 2012 | |||||||||
| 2013 | |||||||||
| 2014 | |||||||||
Bar passage rates have already started to decline. In 2014, bar passage rates declined across the country, although the ExamSoft debacle has created uncertainty about how to apportion causes. Bar pass rate declines in 2015, which have started to trickle in as of this report’s publication, will be explained by more at-risk students enrolling in 2012. Unless states make the bar exam easier or law schools better prepare students for the bar exam, we can expect pass rates to continue falling because risk profiles have plummeted since 2010. While 30 schools were serious risk based on their 2010 LSAT-25 (22 high, 4 very high, 4 extreme), 74 schools are serious risk based on their 2014 LSAT-25. More than one in eight ABA-approved schools now fall in the extreme risk category (26 schools), while 19 schools are very high risk and 29 schools are high risk. Just one school improved its LSAT-25 risk profile between 2010 and 2014, from very high to high risk, although five other schools increased LSAT-25 without changing risk profiles.
Considering risk profiles based on LSAT-50, nine schools were serious risk in 2010 (3 very high, 6 high), but now there are 37 (7 extreme, 11 very high, 19 high). Just one school improved its LSAT-50 risk profile, from low to minimal risk. For risk profiles based on LSAT-75, two schools were serious risk in 2010 (both high) and both achieved sub 70% bar passage rates. In 2014, 16 schools are serious risk based on LSAT-75 (1 very high, 15 high).
These figures, moreover, may understate the degree of risk that some schools have undertaken—along with the risk they have imposed on their students. Schools report only the interquartile figures for their entering class; they do not provide more detail on the tails of the distribution. In this respect, LSAT-25s are like the visible portion of an iceberg. The remaining students might be at or just below the LSAT-25 waterline, or they might be dramatically lower, creating a hidden danger that schools are admitting far too many at-risk students, which will only be revealed when the students take the bar exam three years later.
As an example, consider a school with an entering class of 200 and a 150 LSAT-25. Of the 50 students below the LSAT-25 mark, the school might have just one student with an LSAT of 150, 39 in the high risk band (147-149), and 10 in the very high risk band (145-146). This would be a high, but not unreasonable risk profile, particularly if the students with low LSAT scores had higher undergraduate grades. Or the school could have nine students in the high risk band (147-149), 20 in the very high risk band (145-146), and 20 more in the extreme risk band (144 and below). This would be a much riskier and possibly unreasonable profile with a full 20% of the class at very high or extremely high risk of failure.
In times like these, when there is huge pressure on the admissions department to find tuition-paying students, the temptation to admit large numbers of poorly qualified students, particularly when doing so is undetectable to outsiders, is great. Many schools may have already succumbed to the temptation.
We reiterate that not all LSAT declines are the same. By way of example, consider Brooklyn Law School and Suffolk University Law School. In 2010, Brooklyn had an LSAT-25 of 162 (85.9 percentile) and Suffolk had an LSAT-25 of 152 (52.2 percentile). Brooklyn's 2010 LSAT-25 risk profile was minimal and those students achieved a 92.7% bar passage rate in 2013. Suffolk’s incoming class in 2010 had a modest LSAT-25 risk profile, with a pass rate of 81.7% in 2013. Fast forward to 2014: Brooklyn's LSAT-25 dropped 9 points and 30.3 percentile and Suffolk's LSAT-25 dropped 9 points and 31.7 percentile. Brooklyn only declined to low risk, whereas Suffolk declined to extreme risk. Meanwhile, Suffolk's LSAT-50 risk profile is very high risk — the median LSAT dropped 37.9 percentile from 156 to 146.
As these numbers show us, legal education now navigates uncharted territory. The bar exam performance of graduates of many serious risk schools in 2010 was concerning, but relatively benign compared to where we stand today. A large number of students attending law school today would never have been admitted just a few years ago. While some of these students may succeed, many more will struggle and fail.
Serious risk law schools did not take enough students with better undergraduate GPAs
While the LSAT is the strongest predictor of bar success pre-law school, undergraduate GPA has predictive value too (just less). Thus, a law school could reasonably admit some students with lower LSAT scores, so long as those LSAT scores were balanced by proportionately higher UGPAs. However, law schools do not report both the LSAT score and the GPA of individual admitted students, only the overall group statistics of the admitted class. If a school admits students with significantly lower LSAT scores but also significantly higher GPAs to balance the predictors, there is no way to know this based on available data. Nevertheless, a close analysis of GPA median and interquartile ranges strongly suggests that this is not happening, and that any claim that that a law school is mitigating the risk of admitting students with low LSAT scores by accepting only strong undergraduate students should be viewed with skepticism.
If a school mitigates the risk of lower LSAT scores, we expect undergraduate GPA increases to show up in one or more of the GPA-25, GPA-50, and GPA-75. Of the 74 serious risk schools based on LSAT-25, 26 schools (35%) improved one or more of their GPA quartile measures. Three schools improved GPA at all quartile marks; six at improved two quartile marks; and 17 improved at one quartile.
But the question is not whether the schools improved GPA profiles. The question is whether the GPA improvement sufficiently counteracts the impact of an LSAT decline with GPA. For schools that already had low bar passage rates in 2013, of course, even some improvement in GPA would be unlikely to adequately mitigate its graduates’ risk of bar failure.
Using data published by the NCBE, we can tell how GPA and LSAT increases affect the likelihood of gaining or losing a point on the Multi-State Bar Exam (MBE). A GPA change of .07 translates into about one MBE point; one LSAT point translates into about 1.1 MBE point. When a test-taker's MBE score goes up or down, so do the chances of passing the bar.
Using the above MBE conversion, here's the average movement for each quartile mark at serious risk schools between 2010 and 2014:
| LSAT-25 | LSAT-50 | LSAT-75 | GPA-25 | GPA-50 | GPA-75 | |
| LSAT or GPA Change |
-4.6 | -3.7 | -3 | -.10 | -.09 | -.07 | MBE Points Change |
-5 | -4.1 | -3.3 | -1.4 | -1.3 | -1 |
At least on average, serious risk law schools did not mitigate the decline in LSAT with their GPA profiles. But as we mention above, some schools did increase GPA at one or more quartile marks. Checking whether the school enrolled more at-risk students than before is tricky, however. Much depends on a law school's admissions strategy. For instance, a school may choose to admit a student with an extreme risk LSAT only if that student's GPA was above its previous GPA-75. Alternatively, a school may admit virtually everybody and wait to see where the chips fall.
We tested nine admissions scenarios to see how they affected MBE scores. Scenario #1: Compared to a student admitted in 2010 with an LSAT equal to the school's 2010 LSAT-25 and a GPA equal to the school's 2010 GPA-75, how many MBE points would we expect a student to gain or lose with numbers matching 2014 LSAT-25 and GPA-75? The other eight scenarios include every combination of GPA and LSAT quartile change between 2010 and 2014.
In total there were 666 tests (74 schools x 9 scenarios), but only six schools saw any improvement in at least one scenario. Of the 666 tests, four saw no change in expected MBE score and 31 saw at least some change in expected MBE score. One school (Detroit Mercy) saw an improvement in all nine scenarios, another (Liberty) in eight of nine. These two schools accounted for more than half of the positive expected values.
The expected values had a wide range. The positive expected values ranged from .37 to 3.16, averaging an additional 1.25 expected MBE points. The negative expected value ranged far wider: -.14 to -14, with an average loss of 5.9 expected MBE points. The serious risk schools with positive values increased the odds of bar passage a little and those with negative values decreased their odds a lot.
Changing the academic experience
To maintain student completion and bar passage rates, despite the dramatic increase in at-risk students, law schools must pour resources into remedial work or new teaching strategies. Unfortunately, spending money to mitigate risk increases the cost of education — the opposite of what law schools need to do. And as numerous law school administrators and consultants tell us, no one has yet identified a magic elixir for improving bar performance among students who score poorly on the LSAT. If any schools do figure out how to improve bar outcomes for students with low predictors, they have a duty to share that information with other schools and at-risk students — with an emphasis on empirical data rather than hopeful conjecture.
One school has aggressively fought the perception that the LSAT scores of its students destine them for bar failure; instead, the school touts the resources it invests in helping these students succeed. In a guest essay on The Faculty Lounge, Charlotte School of Law’s dean addressed those efforts while addressing critical commentary about the school's admissions standards.
Despite Charlotte's efforts, its bar results have fallen each year since 2013. For the July 2013 administration, Charlotte's graduates achieved a 60.4% first-time pass rate in North Carolina. For July 2014 and July 2015, Charlotte's first-time pass rates fell to 56% and 47.1%, respectively.
| Charlotte School of Law | ||||
|---|---|---|---|---|
| LSAT-25 | LSAT-50 | LSAT-75 | July Bar Results, NC | |
| 2010 1Ls | High | High | Modest | 60.4% |
| 2011 1Ls | Very High | High | Modest | 56% |
| 2012 1Ls | Extreme | Very High | Modest | 47.1% |
| 2013 1Ls | Extreme | Extreme | High | ??? |
| 2014 1Ls | Extreme | Extreme | Very High | ??? |
Attrition trends
After a law school admits its 1L class, the school uses minimum GPAs, individual counseling, and mentoring to manage its student body. The ABA collects data on the non-completers to protect students from unfair enrollment management. Beginning two years ago, the ABA began categorizing non-completers in three distinct categories: transfers, academic attrition, and other attrition. A transfer is a student who left the school for another school. A student whose academic performance renders them ineligible to continue qualifies under academic attrition. All remaining non-completers fall under other attrition. That category includes students who are counseled to leave, who decide that completing the degree is not worth it, or who leave for personal reasons. The new definitions will ultimately strengthen the datasets, but the available ABA attrition datasets are inconsistent and do not support historical comparisons. Instead, we only examine involuntary academic attrition after the first and second year of law school, starting with the class that entered in 2010.
When a law school takes a greater proportion of at-risk students, without developing compensatory academic programs, we expect academic attrition to increase — assuming the school manages enrollment responsibly. The students they allow or counsel to continue must be able to pass enough classes to graduate, and must also be equipped to pass the bar exam.
Under some circumstances, academic attrition may decrease with more at-risk students without ringing the professional ethics alarm. A school may use new admissions criteria, such that the traditional predictors serve only to mislead traditional expectations. Better academic support may have eased the law school acclimation process for at-risk students. A smaller class may mean more individual attention and feedback, thus fewer failing grades if the number of failing grades is not mandatory.
Alternatively, academic attrition may decrease despite more at-risk students if a school faces financial pressure — precisely what the ABA aims to protect through its accreditation standards and data-collection efforts. Unconscionable efforts by schools to hang on to students to assuage revenue concerns, especially those paying full price because they lost their conditional scholarship or never had one in the first place, cannot be identified through data alone. But available data provide the ABA and other investigators an excellent starting point.
For 1Ls entering in 2010, academic attrition was 3.3% after the first year. The percentage remains remarkably steady for the three subsequent entering classes. The pattern holds well for both serious risk schools and other schools. The serious risk schools did see academic attrition increase .5%, from 6.6% to 7.1%, but this amounts to only failing an extra 70 students each year. Second-year academic attrition remains steady for subsequent cohorts too.
| Academic Attrition After First Year | ||||
|---|---|---|---|---|
| 2010 1Ls | 2011 1Ls | 2012 1Ls | 2013 1Ls | |
| All Schools | 3.3% | 3.3% | 3.5% | 3.4% |
| Serious Risk Schools | 6.6% | 6.7% | 6.9% | 7.1% |
| Other Schools | 1.2% | 1.2% | 1.3% | 1.2% |
This is not at all what we would expect given the steady decline in LSAT-25 each year. Steady academic attrition may be explained by law schools not adjusting their grading curves to account for academically weaker students. Unfortunately, a higher danger point for law school GPA may impact how well law school GPA predicts bar passage and how accurately a school can target students who need extra help on the bar exam.
III. What Do We Know About Serious Risk Schools?
Who's paying more?
At-risk students. Not only did 74 law schools enroll at least 25% of their entering class with a high risk profile or worse, but those at-risk students subsidize tuition for peers who are more likely to pass the bar exam and obtain gainful employment. Scholarships are predominately provided in exchange for relatively higher LSAT scores and, to a lesser extent, GPAs. As price discrimination shifts even more dramatically towards discounting tuition for those most likely to complete school, pass the bar, and obtain a legal job, those who are more likely to struggle pay even higher prices.
Over the past 15 years, "stated tuition prices have increased at a greater rate than discounts." [ABA TF Report, pg 27] This means that each year the situation worsens for those subsidizing their better credentialed peers, despite widespread claims that law schools have been more generous with scholarships. At least in prior years the subsidizing cohort was more likely to pass the bar.
According to the most recently provided tuition data, the percentage of students paying full price at extreme risk schools (45.5%) is higher than students at every other risk band. If we break schools into two categories — serious risk schools (74 schools) or others (123 schools) — we see that more students pay full price at the serious risk schools. At the serious risk schools, 43.1% of students pay full price versus 34.7% at the other schools. Surprisingly, sticker tuition is just $1750 less on average at the serious risk schools. Even comparing the difference in net tuition only increases the price difference by $155.
| 2014 LSAT-25 Risk Profile | Sticker Tuition | % Paying Full Price | % Paying Half Price+ | Avg. Net Tuition | Avg. Discount Rate |
|---|---|---|---|---|---|
| Extreme | $31,990 | 45.5% | 80.5% | $26,857 | 16.7% |
| Very High | $35,382 | 39.7% | 78.6% | $30,499 | 15.4% |
| High | $34,790 | 43.1% | 78.1% | $29,517 | 15.6% |
| High / Very High / Extreme | $33,958 | 43.1% | 79.1% | $28,834 | 15.9% |
| Minimal / Low / Modest | $35,708 | 34.7% | 76.5% | $30,739 | 14.7% |
| Modest | $29,283 | 37.2% | 77.3% | $24,814 | 16.7% |
| Low | $34,748 | 32.4% | 73.5% | $30,053 | 13.8% |
| Minimal | $41,456 | 34.1% | 77.7% | $35,919 | 13.6% |
| All | $35,050 | 37.8% | 77.5% | $30,023 | 15.1% |
Even if a student at a higher risk school receives a scholarship, that scholarship is more likely to be conditional. That is, retaining the scholarship depends on law school performance, which the LSAT is designed to predict. Frequently, more of these scholarships are provided to incoming students than can possibly keep them. Over 80% of serious risk schools offer conditional scholarships, with 30.1% of those scholarships being eliminated. Less than half of the other schools offered these scholarships, which were more likely to be renewed.
| 2014 LSAT-25 Risk Profile | Percentage Offering Cond'l Scholarships | Elimination Rate |
|---|---|---|
| Extreme | 80.8% | 30.7% |
| Very High | 89.5% | 27.3% |
| High | 75.9% | 31.8% |
| High / Very High / Extreme | 81.1% | 30.1% |
| Minimal / Low / Modest | 48.0% | 24.4% |
| Modest | 63.4% | 28.4% |
| Low | 64.5% | 21.4% |
| Minimal | 25.5% | 21.2% |
| All | 60.4% | 27.3% |
How do graduates of serious risk schools fare in the entry-level job market?
Very poorly. On average, 2014 legal job rates should improve for current students because enrollment has fallen drastically, especially at the serious risk schools. However, how these job rates will shake out depends largely in part on these students passing the bar exam. The legal job rates in 2014 were decidedly worse at the serious risk schools.
For the entire class of 2014, the average legal job rate was 60.6%. In total, 95 schools (48.2%) were at or above average, but just 14 of the 74 serious risk schools (18.9%) were. For schools with legal job rates below 50%, 73.6% are serious risk, with the percentage rising to 89.5% when we look only at legal job rates below 40%.
In some sense, this is not surprising because the bar passage rates are considerably worse at the schools with the worst legal job rates. One saving grace for the serious risk schools may be significantly reduced enrollment. If the schools act responsibly with the students they enroll, i.e. not allowing students to continue to study and pay tuition unless they appear capable of succeeding through the rest of school and on the bar, the graduating classes of the future will be even smaller. But so far we have not seen evidence that serious risk schools are increasing academic attrition to compensate for less able students. We expect financial pressure is to blame rather than increased success in helping students get through school. Schools had powerful incentives to improve their education to improve pass rates before enrollment collapsed.
Are for-profit law schools making more irresponsible choices than their non-profit and public peers?
Yes. Six for-profit law schools, 80 public schools, and 111 private schools were analyzed in this report. The for-profit schools were disproportionately represented in negative ways. In 2014, 4/6 for-profit schools had an extreme risk profile based on LSAT-25. As the other two schools were very high risk, 100% of for-profit law schools were serious risk based on LSAT-25. An unacceptable number of public schools (18, 22.5%) and private schools (50, 45%) were serious risk, but the percentages were significantly lower than for-profit schools.
Looking at LSAT-50 risk profiles, 21.6% of private schools and 8.8% of public schools were serious risk, while 100% of for-profit schools were (3 high risk, 3 extreme risk). Those three extreme risk for-profit schools, all owned by Infilaw, also had an LSAT-75 that put the schools in serious risk — one very high and two high risk. That means that between 75% and 100% of students at the Infilaw schools (Charlotte, Arizona Summit, and Florida Coastal) face at least high risk of not completing school or passing the bar exam.
The six for-profit schools did not have any room to breathe based on 2010 risk profiles and 2013 bar exam results. The average bar passage rate was just under 70%. Between 2010 and 2014, the average LSAT-25 fell 17.8 percentile from 148 to 142; the average LSAT-50 fell 16.5 percentile from 150.3 to 145.7; and the average LSAT-75 fell 15.3 percentile from 153.2 to 149.2.
While we do not yet have the 2014 composite bar passage rates that the schools report to the ABA, we do know the July 2014 bar passage rates in each school's most popular state:
| July 2014 Bar Exam Results, For-Profit Schools | |||
| State | Pass Rate | 2011 Risk Profiles (25th/50th/75th) | |
| Western State University | CA | 71.30% | High / Modest / Low |
| Charleston School of Law | SC | 65.30% | High / Modest / Minimal |
| Atlanta's John Marshall Law School | GA | 59.60% | High / Modest / Modest |
| Florida Coastal School of Law | FL | 58% | Very High / High / Modest |
| Charlotte School of Law | NC | 56% | Very High / High / Modest |
| Arizona Summit Law School | AZ | 54.70% | Very High / High / Modest |
We also know that, for the July 2015 exam, 30.6% of Arizona Summit's first-time takers passed in Arizona, 47.1% of Charlotte's first-time takers passed in North Carolina , and 59.3% of Florida Coastal's first-time takers passed in Florida, and . Each of these schools had the same 2012 risk profiles: Extreme / Very High / Modest.
Of course, successful bar exam performance is important, but only just a start to understanding how well a school serves its students and the public. Troublingly, tuition at for-profit schools averaged $41k in 2014, an increase of 17.9% since 2010. With over 90% of graduates borrowing, the average 2014 graduate borrowed $143k, 22% more than 2010, yet only 38.7% had a long-term, full-time legal job. And despite enrollment falling 33.1% between 2010 and 2014, for-profit schools were still on average 70% larger than public schools and 30% larger than private schools.
Can graduates of serious risk schools afford their debt?
No, they cannot service their debts without generous hardship programs from the federal government.
The most recent school-specific salary data we have is for the class of 2013. Of the 74 serious risk schools, 36 reported the salary interquartile range, median, and mean for all employed graduates. The average salary response rate (# reporting salary / # employed) was 48.6%. If we use all graduates as the denominator, the average response rate was 38.6%. Nationally, the salary response rates were 57.1% and 47.3%, respectively. The difference between the national averages and the average for the serious risk schools can likely be explained by the type of jobs that have the highest salary response rates and the fact that those jobs, i.e. clerkships and jobs at large law firms, are not concentrated at the serious risk schools.
When we remove schools that did not have a response rate of at least 30% using the number employed as a denominator, the average mean is about $59k, the average median is about $54k, and the interquartile range is $44.5k to $68.5k. These numbers likely overstate the salary outcomes because of the high levels of unemployment and short-term work, but nevertheless help provide a conservative look at repayment difficulty.
Graduates in the class of 2014 at serious risk schools borrowed on average $120k to attend law school. Assuming no change in combined tuition and cost of living expenses, the average student borrowed $40k per year. In 2012 and 2013, the interest rate for half was 6.8% and 7.9% for the other half. In 2014, the interest rate for half was 6.41% and 5.41% for the other half.
By the time the first payment was due six months after graduation, at which time any accumulated interest capitalizes, the average student at a serious risk school owed $141k, which translates to about $1600 per month for ten years. At some schools, the average debt nears $200k and a $2300 monthly payment. At the lower end, some serious risk schools average around $80k debt and a $900 monthly payment.
The curious patterns with schools that withhold debt data
Over 90% of schools have voluntarily disclosed the average amount borrowed and average percentage borrowing over the last five years. For the graduating classes of 2010 and 2014, a total of 13 schools did not report both datapoints for both years.
The did-not-report ("DNR") group of schools are more likely to enroll at-risk students. While 34% of non-DNR schools had a serious risk LSAT-25, 85% of DNR schools did. The LSAT-25 for the DNR group was 6 points lower than any other group; and all of the other groups were within 3 points of each other. Moreover, 69% of DNR schools were serious risk at LSAT-50 and 46% were at LSAT-75.
The non-DNR schools were 35% and 37%, respectively. The DNR schools also drag down the national bar passage rate, have significantly worse job outcomes, and shed the most number of students.
This all may be a coincidence, but we find it strange that such a pattern emerged from not reporting two datapoints voluntarily. What seems to bind these schools together is the desire to keep debt figures a secret and significant financial pressure from falling enrollment.
The mean and median salaries at serious risk schools cause somewhere between economic difficulty and catastrophe. One common-sense rule in student lending stipulates that students should not borrow more than they expect to earn after their first year. Law schools of all types make observing that rule difficult. The following table uses the above income and monthly payment estimates to see what percentage of discretionary income (income above 150% of the federal poverty rate for a single person with no dependents) covers a student's full loan payment.
| Financial Starts for Graduates of Serious Risk Schools | ||||
| Income Estimate | Percentage of Discretionary Income by Monthly Payment | Hardship Payment | ||
| $900 | $1600 | $2300 | ||
| $44.5k Bottom Quartile Income | 40.2% | 71.5% | 102.8% | $224 |
| $54k Median Income | 29.7% | 52.8% | 75.9% | $303 |
| $59k Mean Income | 26.1% | 46.4% | 66.8% | $345 |
| $68.5k Top Quartile Income | 21.2% | 37.8% | 54.3% | $424 |
For now, all of these graduates qualify for the Pay As Your Earn ("PAYE") federal hardship program, which allows the borrower to limit loan payments to 10% of discretionary income. After 10 years of public service, the remaining balance will be forgiven. After 20 years in the program, everybody else has the remaining balance wiped clean, although they are responsible for paying income tax on the forgiven principal. The hardship programs help these graduates get by, but interest will continue to accumulate and there are several snags that can cause the interest to capitalize and increase the tax bomb.
Strikingly, even the success stories at the relatively cheaper schools — as told through having a legal job and income, at least — leave graduates with more debt than any financial advisor would recommend. However, the stress and potential ruin awaiting the very many who do not succeed right away is unnerving. The average borrowed is highest at the extreme risk schools ($123k), along with the highest percentage borrowing (90.1%). About 80% of the serious risk schools have graduates borrowing more than $100k, even before accounting for interest.
In a world with PAYE, default rates matter less and less. More than anything default rates signal a lack of financial education by the school and government. When it comes to imminent changes to federal student loan policy and the government's evaluation of whether there are better investments to make, i.e. undergraduate Pell Grants, the percentage of people on PAYE with little hope of paying back any principal let alone all of it will matter. It is impossible to use available numbers to produce a reasonable estimate for that percentage, but these graduates are starting out behind the eight ball — exactly the opposite of the opportunity these schools promise to provide students, the profession, and the public.
What is the socioeconomic status of students at the serious risk schools?
Lower. The concept of socioeconomic status centers on access to resources, whether education, income, wealth, power, or networks. Apart from the negative consequences of the continued stratification of the legal profession and the impact that has on legal services, we focus on how those with lower socioeconomic status appear to be sorting into schools that will produce worse challenges than those with higher socioeconomic statuses.
Through public disclosures by law schools about graduate borrowing, we have access to two simple proxies for socioeconomic status: the percentage borrowing and the amount borrowed. Arguably, LSAT score provides a third readily available proxy, but it is not as clear cut.
The percentage borrowing reflects how many graduates borrowed at least $1 in student loans to attend a law school. The amount borrowed reflects the average loan disbursement to those graduates. The amount borrowed does not include interest that accumulated during law school, debt from other degree programs, or private debt related to attending law school.
Here, we focus on the percentage borrowing. We split law schools into three groups by the percentage borrowing. The groups are >90%, 80%-90%, and <80%. Of the 31 schools with a borrowing rate greater than 90%, which suggests lower socioeconomic status, 23/31 (74.2%) are serious risk schools based on 2014 LSAT-25. Those 23 schools were all in the top 25 schools by borrowing percentage. On the other hand, just 3/59 (5.1%) of schools with a borrowing rate under 80%, which suggests higher socioeconomic status, were serious risk schools.
Additionally, debt since 2010 has grown at the fastest rate to the highest average amount at the schools with the highest borrowing percentage. The average 2014 legal job rate was also substantially lower at these schools. Only 47.1% obtained a long-term, full-time legal job by 10 months after graduation. The schools with a greater concentration of higher socioeconomic status students had an average legal job rate of 70.9%.
IV. What Do We Do?
Taking into account falling admissions standards at many law schools, and the failure of those schools to adjust academic attrition rates accordingly, we can predict with a great deal of confidence that bar passage rates will drop significantly at many law schools over the next three years, leaving thousands deep in debt with few prospects for employment that will enable them to pay off their debt.
We foresee finger-pointing by law school administrators and faculty, students, alumni, bar leaders, and more. But what, if anything, should be done to the law schools contributing to this crisis through irresponsible admission practices? If almost all law schools are experiencing a decline in bar passage, should we hold any law school accountable? If a school stays within 15% of the state average for first-time bar passage, thereby meeting the ABA Standard, should we give that school a pass no matter how low the overall pass rate is?
This report indicates that future bar passage rates will not satisfy students or the public. Examining how to hold schools accountable raises questions about how to balance providing/removing opportunities, consumer protection, and the efficient allocation of societal resources.
Consider California's requirement that state-accredited law schools achieve a minimum 40% bar passage rate. The standard reflects an accreditor satisfied when, of the students who manage to complete school and take the bar, 40% pass the exam. The standard reflects one possible resting place between consumer protection and opportunity. California-accredited schools claim to provide opportunities to students that ABA-approved law schools will not. The standard reveals a bargain where the aggregate costs are purportedly worth the aggregate benefits. Among a group of applicants, we know some will succeed. We also know that some will not. However, we cannot determine who is who, so we provide everybody the opportunity to prove themselves.
But should we be comfortable with that trade-off? Naturally, it depends. We need to consider the benefit of enabling those successes, both for the individuals and their communities. We also need to consider the costs imposed on non-completers, those who fail the bar at least once, and society. Finally, we also need to consider whether we have found the best way to provide opportunities.
Benefits abound from providing the opportunity to obtain a legal education and become a lawyer. As we have reiterated throughout this report, the LSAT is not a measure of a person or their ability to serve clients well, even if it is our best pre-law predictor for the bar exam. Yet the bar exam remains an unrelenting barrier to practice. Many who eventually pass the bar will go on to serve clients, earn a wage premium, contribute to the economy, and do their part to ensure justice for all. Particularly in disadvantaged communities, law school helps leaders emerge who can provide inspiration and legal service to those in need. Building a legal profession that reflects society requires real opportunities to those who otherwise would not have them.
However, the costs are tangible. The majority of law students attend law school full time, thus taking three years out of the labor market. Opportunity costs include income, raises, and work experience. Students must also make cash or debt-financed expenditures to pay for tuition, books, and living expenses. After graduation, student loan payments will be made at the expense of savings and home equity. These costs could set students back years or decades if they fail the bar. The tournament of opportunities also imposes costs to society. Every single person admitted to law school has the ability to contribute meaningfully to society. Students who do not complete law school or pass the bar may have created jobs or filled important needs in the labor market had they not gone to law school. Students who borrow and fail to repay push the price of lending up, especially when principal is over $100,000 or even $200,000.
One study in the Journal of Legal Education of test-takers who never passed the bar exam concluded that “if law school bestowed a benefit to the lives of never-passers at all, it didn’t begin to pay dividends until the latter half of their careers, and likely couldn’t ‘pay back’ the harms that the law school experience seemed to have caused during the first half.” The study also suggests that never-passers have higher divorce rates than college graduates, and that they are less likely to have children. These costs are borne by the individuals and society alike.
We can imagine shaping law schools in a way that provides opportunities while more quickly identifying and dismissing those who are very unlikely to pass the bar exam. We can also imagine a system of incentives for schools with successful track records to take more chances on promising at-risk students. Schools that are genuinely interested in providing opportunities to students who otherwise would not have had them can also shift financial aid resources to them instead of those most likely to succeed. Taking the bite out of costs through greatly reduced tuition lessens the risk and proves these students are there to receive an opportunity not to be a conduit to federal student loan dollars or subsidies for those who are more likely to succeed.
The 40% bar passage rate may be acceptable for California-accredited schools, although recent public scrutiny suggests that policymakers will reevaluate that balance. ABA-approved law schools, though, are far more expensive, with many graduates facing economic catastrophe. With such risk involved, the minimum bar passage rate must be much higher than the California rate and higher than the ABA requires now.
As this report shows, many problems — high debt, poor job outcomes, poor bar passage rates — are concentrated at schools enrolling the largest number of at-risk students. To remain financially viable, these schools must enroll more at-risk students who do not have better options but nevertheless want to attend law school. While we expect these schools to claim that they are placing bets on students seeking opportunities other schools won't provide, the reality is that these schools are placing a bet that the profession, accreditors, and government will stand idly by. Students seeking to improve their station in life or hoping to make a positive change through the law deserve better. A society that depends on the rule of law needs better.
Some schools have a short route to fairness. We hope our report stirs faculty members at those schools to pressure their administrations to make difficult choices, even though in some cases this will be against their personal interests. Other schools have a hopeless road ahead of them. Faculty members at those schools must consider whether the institution should have a future. Debating the balance between long-term and short-term value when it comes to jobs, income, and debt is one thing, but a school's imperative to produce graduates who pass the bar is crystal clear. For the schools that persist full steam ahead — and there will be many of these schools — we must find creative ways to stop them.
The lawyer's role in society is profound and essential, even if undergoing a radical transformation due to globalization and technology. Whether tomorrow's lawyer has the same tasks and responsibilities is separate from the fact that the legal profession will always encompass people involved in private ordering and the administration of justice. As law schools pursue educating tomorrow's lawyers, all stakeholders must demand that schools serve their pipeline function fairly and affordably.
V. Call to Action
This investigative report is a call to action for the following stakeholders. Click a stakeholder's box to view its action items.
Use Rule 6 and Rule 7 of the accreditation standards to investigate compliance with Standard 501. Vigorously enforce Standard 501 and Standard 316. Raise the standards on Standard 316. Require more consumer information. Move part of the bar to the end of 1L.
Monitor whether the ABA enforces its standards in accordance with the law. Change the student loan program to eliminate blank checks.
Enhance the rules of professional conduct. Work with the ABA to hold law schools accountable and improve consumer information.
Familiarize yourself with the risks your school takes. Show the legal community your goal is to provide opportunities. Recognize some law schools have divergent interests. Shift to a transparent pricing model.
Examine your law school's entering class credentials. Reallocate university resources and energy away from failing law schools and towards law-related projects.